The ARM Cortex-M microprocessor equips a very useful piece of embedded tracing hardware called the ITM, instrumentation trace macro-cell.
Using the STM32CubeIDE development tools, the embedded developer can display the following SWV ITM Data Console panel with arbitrary debug text.
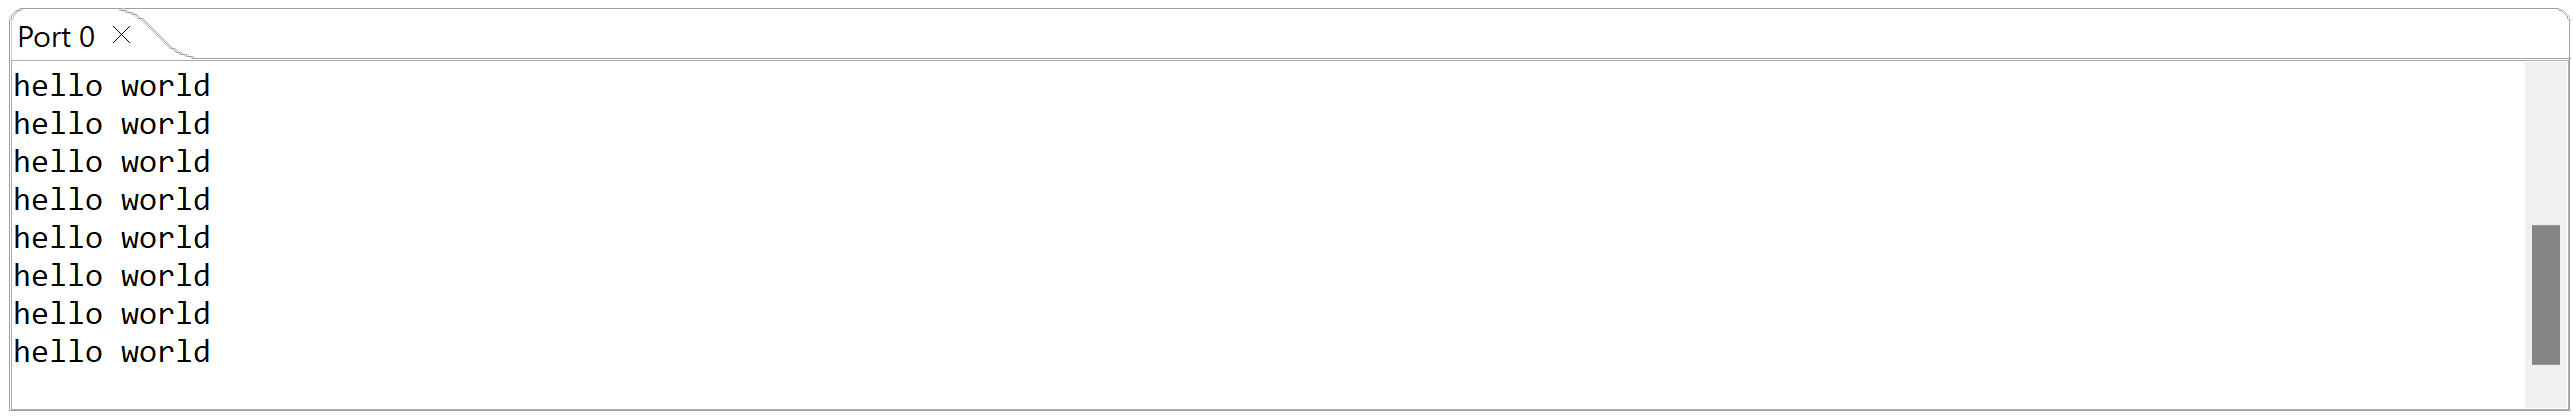 These messages appear on the host when running the code below in debug mode on the embedded board.
  for (;;)
  {
    printf("hello world\n");
    osDelay(1000);
  }
Motivations
Embedded projects can use the ITM to log debugging text at the chip level. The on-chip hardware handles the buffering and synchronisation with the development host, and therefore no need to build a debugging pipeline using software with its run-time resources that might itself impact the performance of the embedded system under test, e.g. use more memory and processor cycles just to debug. Using ITM, the impact is minimal since outputting text only requires a register-write operation. Formatting will still have to occur but that too typically has a small and insignificant debugging and tracing impact.
Getting it up and running proves a little tricky at first and its reliability can seem less than total until the developer starts to grasp the minutiae—multiple moving parts.
Strong put character
The firmware links with newlib. Underneath the bonnet, the low-level system interface weakly calls __io_putchar for output to stdout. Provide an implementation using ITM_SendChar as follows.
#include "stm32l4xx.h"

int __io_putchar(int ch) {
	(void)ITM_SendChar(ch);
	return 0;
}
Very simple. The return values have no meaning and get ignored, and that goes for ITM’s “send character” as well as the “put character.” ITM_SendChar returns its argument even if ITM is disabled and Port 0 is disabled. It gives no success or failure indication.
Debug launch on STM32CubeIDE
The debugger needs some essential setup in order to make the output appear in the STM32CubeIDE’s Data Console. The following need to be set to true in the Debug launch configuration, or in the Release configuration if preferred.
- Serial Wire Viewer (SWV) Enabled, i.e.
launch.enable_swvto true, and - open the Configure trace, i.e.
launch.swv_config_enabledto true in the launch configuration
Also, the HCLK needs synchronising with the processor.
- Core Clock (MHz)
launch.swv_trace_hclkto47333333, or 47.333333MHz matching the HCLK, plus - ITM Stimulus Ports, Enable port 0, or
swv.itmportsto1for Port 0 stimulus
Make these changes via the STM32CubeIDE; they affect the launch configuration in XML. The keys above refer to the XML keys with the prefix com.st.stm32cube.ide.mcu.debug within the launch configuration XML file.
Importantly, make sure that the trace has started by enabling the Start Trace button.
Conclusions
The ITM is a useful piece of hardware for debugging, and not just for printing messages. Connecting __io_putchar to ITM_SendChar lets the ITM’s Port 0 act as a standard output channel to which debug code can format and output with convenience as if writing to a standard file output descriptor on a Unix-like box, even though actually running on an embedded single-chip with only newlib as the standard library.
It matters where and when the ‘put character’ runs. The output fails to appear if too early in the microprocessor support initialisation; trying to move the debugging further down the timeline.